The Staff of HS2 Ltd have replied to our letter of 1st May to Sir David Higgins (Chair of HS2 Ltd). Our response to that and the HS2 letter itself are here.

The Staff of HS2 Ltd have replied to our letter of 1st May to Sir David Higgins (Chair of HS2 Ltd). Our response to that and the HS2 letter itself are here.
This follows from Beleben’s post of 28th May reproduced below.
……………………..
Our Facts Sheet 6, updated January 2012, provides:This facts sheet was first produced in August 2002. The update is the same as the original except for minor typographical changes and the addition of the latest cost of for the West Coast Main Line Modernisation Programme.
1. At privatization in 1994 the British Rail forecast for track maintenance beyond 2001 was £774 million per year (source, page 11 of the prospectus issued in advance of sale). At 1999 prices that amounts to £0.888 billion.
2. In contrast the network management statement for the years 1996/7 and 2000 provide an annual average for the 10 years 1995/6 to 2005/6 at 1999 prices of £2 billion per year. The 2001 network statement provides an average of nearly £3 billion per year at the 2001/02 price base for the five years 2001/2 to 2005/6. Thereafter the cost is forecast to taper off to £2.2 billion in 2010/11.The increase from £0.888 bn to nearly 3 billion, a factor of over 3 is typical of the appalling record the rail industry has for estimating its costs. Other illustrations follow at 3, 4 and 5 below.
3. The West Coast Main Line Modernisation Programme was to cost £2.35 billion in 1997, £2.95 billion in March 1999, £4.75 billion in October 1999, £5.56 billion in January 2000 and £5.8 billion at the start of the Public Inquiry in February 2001. (Source is the Overview Paper produced in May 2000 and a report to the Rail Regulator by Booz-Allen and Hamilton dated June 2000). The price rose to £6.3 billion during the inquiry when there were press reports that it would cost £9 billion. By August 2002 the press was reporting £13 billion, but that was cut to £10 billion after the Regulator struck out enhancements otherwise required for the originally proposed 150 mph speeds. That was reduced to £7.3 billion only to rise to £10 billion as reported today, January 2012.
4. An old cost for the Train Protection System is £1 billion but that rose to £6 billion according to the press but the number is now quoted as £3.8 billion.
5. Meanwhile the overall cost of Railtrack’s original nation-wide Modernisation Programme rose from £50 billion through £60 billion to a projected £73 billion – Sufficient to build the residential accommodation for a city of 1.5 million people. Where that programme now stands is not clear.The original cost estimates misled the Government and shareholders into commitments which may never have been considered if the actual costs had been available. Possibly these massive cost failures are deliberate. In any case they are mirrored by equally massive misrepresentations to do with capacity, safety and other issues, see other facts sheets.
The June 2008 Railnews report “What future for high speed rail in Britain?” gave Greengauge 21’s estimate of the cost of a 177 km high speed railway from London to Birmingham as £7.1 billion, at 2007 prices.
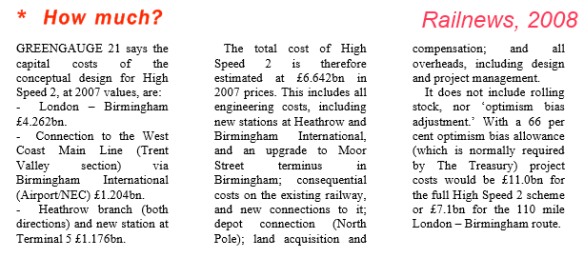 2008 Greengauge 21 estimate for a London – Birmingham high speed line
The 2014 David Higgins HS2 Plus report stated that the government’s ~225 km HS2 phase one proposal was costed at £19.4 billion (P50 estimate, at 2011 prices). However, that does not appear to take account of Camden and Birmingham council aspirations for ‘high quality’ station developments, or the possible effects of “alliancing” on project delivery. Alliancing, an anti-competitive-anti-SME approach favoured by Network Rail, could add £1 billion or more to phase one costs.
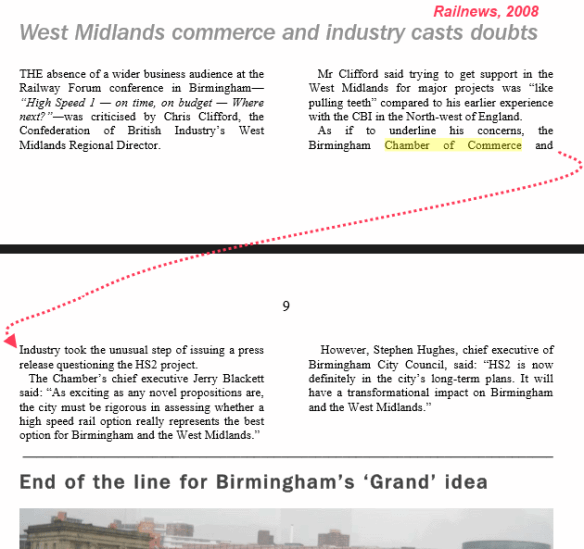 Railnews, 2008
Beleben’s post, “HS2 and construction inflation”, dated 22nd May 2014 provides the cost of the Great Central Line, built at the end of the 19th C, as £11.5 million for 153 route-km yielding £75,000 per km. A multiplier of 110 converts to current prices, providing £8.25 million per km. In comparison HS2 to Leeds and Manchester would provide 531 route-km at a cost of £42.6 billion, equivalent to £80 million per route-km; nearly ten times that of the GCL.
We go on to point out that the cost of a dual three-lane motorway is circa £20 million per km or £3.3 million per lane-km. That is 12 times less than HS2’s £40 million per track-km. Meanwhile a single motorway lane dedicated to 75-seat express coaches has four times the capacity of HS2′s supposed eighteen 1,000-seat trains per hour…….
Of course an urban motorway would cost more than the value cited above, but the way to create such facilities at a fraction of the cost of new construction is to pave the railways and to manage the resultant network to avoid congestion. Estimates based on actual conversions, available in Facts Sheet 12 of the Transport-Watch web site, suggest a conversion cost of circa £500,000 per lane or track-km or circa one sixth of new motorway construction costs.
“Do not be silly”, I hear you say, “How would London’s rail commuters get there if the railway were converted to a road”?
Well, in central London, and at peak times, the replacement express coaches would occupy only one seventh of the capacity available if the railway were paved, see topic 15 at http://www.Transport-Watch.co.uk where there is a map and some pictures to enjoy. Alternatively peg through the following and miss the map and pictures.
250,000 crushed surface rail passengers enter the centre of London in the morning peak hour. There are at least 25 pairs of tracks. Hence we have 10,000 passengers per inbound track. The 10,000 would all find seats in 150 75-seat coaches, sufficient to occupy one seventh of the capacity of one lane of a motor road the same width as required by a train. (1, 000 coaches per hour at a speed of 100 kph would have average headways of 100 metres).
Furthermore, for all but the longest journeys the express coach would match rail for journey time, while costing perhaps four times less and using a fraction of the fuel. Additionally countless lorries and other vehicles would transfer from the unsuitable rural roads and city streets which they now clog and the endless acres of nearly derelict railway land which abuts so many of our stations would become intensely valuable.
Baroness Kramer, Minister of State for Transport, gave the key note speech on 20th May at the Infrarail exhibition held at Earls Court Exhibition Centre over the three days ending to 22nd. I asked the second question, as follows:
(1) It was jolly good that HS2 would generate 100,000 jobs but the cost would amount to a fantastic £500,000 per job. How many would that vast subsidy destroy in that part of the economy which makes a profit?
(2) Did the Baroness know that it cost the government seven times as much to move a passenger or tonne of freight by rail as it does by road?
(3) Did she understand that the product of that vast expenditure provides only 3% of passenger journeys, 7.5% of passenger-miles and 8.5% of tonne-miles?
The Baroness replied by saying she did not recognise the railway I described, which is a pity because that is how it is.
The assembled multitude cheered, but I was congratulated privately.
Perhaps the problem is that, in the words of Upton Sinclair, “It is difficult to get a man to understand something when his salary depends upon his not understanding it”.
Paul Withrington
Some of us are speculating whether an action for fraud could be mounted against those who have so shamelessly promoted HS2 by way of pretenses to the “transformational”, to the Wider Economic Benefits, and within the economic case generally, see the rest of this blog and Topic 17 within the Transport-Watch web site to appreciate the mammoth scale of the deceptions.
Paul Withrington
Dear Sir David
This letter raises seemingly small technicalities. However, these are straws in the wind which point to a far greater issue.
In response to a FoI request your staff claimed that the organisation does not know the split between business, commuting and other trips. However, that must be dissembling since, without that fundamental data, it would be impossible to carry out the economic analysis.
In lieu of an answer, data in Table 3-4 of the Assumptions report of October (PFM v4.3). 2013 enabled us to make a fairly robust estimate of business trips as a proportion of all trips. .The calculation yields 53.4%, a value which is far above the “one third” cited in paragraph 5.2.13 of the Demand and Appraisal report dated April 2012.
This very substantial and sudden increase arose immediately after the reduction in the value of business time from circa £47 per hour to £32 per hour and the reduction in forecast passengers from 380,000 per day to 310,000. These changes should have reduced the benefits by 35%, so destroying the economic case. However, largely as a result of this huge increase in the highly valued business trips the computed benefits increased by 24% – for Heavens sake
Separately from that, here is a particular example of how the railway and HS2 lobbies routinely behave.
This disgraceful anecdote is mirrored by the recent claim, made by the DfT, that HS2 will have the same capacity as a 12-lane motorway when, in reality, a single express coach lane would offer nearly four times as many seats as would HS2’s eighteen 1,100-seat trains per hour.
Frankly, the analysis and selling of this scheme is now (and always has been) dishonest: a desperately serious matter since tens, if not hundreds, of billions of pounds are at stake.
Stewart Joy, Chief Economist to British Railways in the late 1960’s wrote, in his book, ‘The Train that Ran Away’, that there are those who “… were prepared, cynically, to accept the rewards of high office in the British Transport Commission and the railways in return for the unpalatable task of tricking the Government on a mammoth scale. Those men”, Joy wrote, “were either fools or knaves”; a sentiment which seems to apply with even greater force today than it did in the past.
Against that background, and the attached, I am canvassing people of status (particularly those who work in the railways) to act as whistle-blowers.
Perhaps you would consider that a preferable course to leaving a smear in the pages of history – the waste of tens, if not hundreds, of thousands of working men’s lives.
Yours sincerely
Paul F Withrington
Note, the letter sent to Sir David contained a tabulation and an attachment. To view those click here
Ronald Utt’s paper “America’s Coming High Speed Rail Financial Disaster” is a compelling read. For full enjoyment read the source here. Otherwise savour these quotes:
This piece summarises the main arguments against HS2.
This project is not, as claimed by Graham Nalty, in Local Transport Today of 4th April, a great idea being led by the wrong kind of people. Instead it is an entirely stupid idea sold to the gullible by conmen – men who, in the words of Stewart Joy, Chief Economist to British Railways, in his book, The Train that Ran Away, are “prepared cynically to accept the rewards of high office in the railways in return for the unpalatable task of tricking the Government on a mammoth scale”. Such men, Joy wrote, are “either fools or knaves”.
At what point is irrational enthusiasm mis-selling and at what point is mis-selling plainly fraud?
Notes and calculations
(1) Cost – £43bn for construction plus £7bn for the trains plus £30bn for connections, ref IEA estimate, providing a total of £80bn. The UK population is circa 60m. Family size set to 2.2. Hence the cost per household is £2,933. That ignores tax at 20.9%, included in the economic assessment. Perhaps that should be added. After all, every project or enterprise must make its contribution to the nation.
(2) Financial Loss. Table 15 of the October 2013 Economic analysis shows a financial loss at the 2011 price and discount base of £31.5bn for the “standard case”. Rolling that up at the Treasury Discount rate to the presumed opening year of 2036 provides £74bn. That represents the actuarial loss, at 2011 prices, faced by those then living – supposing the very high passenger forecasts, and the corresponding fares, out to the remote year of 2096, actually arise.
(3) Transformational? HS2 Ltd say that the project will generate 76,000 new passengers-journeys per day, (FoI request 13-873). The 76,000 corresponds to roughly 22.8 million per year. It is only those new trips which can be “transformational” since all the rest (obviously) pre-exist. There are currently 1.5 billion passenger-journeys per year by surface rail, and 43.5 billion passenger-journeys by all modes (walk and cycle excluded). Hence generated, or new, passenger-journeys may account for a trivial 1.5% of all surface-rail journeys and for an even more trivial 0.05%, or one in 2,000, of all passenger-journeys. Clearly that cannot be transformational.
(4) Regeneration – cost per job. If the scheme cost or the long term financial loss are both circa £80bn, see above, and if the supposed £100,000 jobs generated actually arise and are indeed new, and not relocated jobs, then the cost per job is, by division, £800,000.
(5) Wider Economic benefits. KMPG’s report claims £15bn per year. These can only arise from generated or new business and commuter trips, the supply side, since all the rest obviously pre-exist. HS2 Ltd refuse to say how many of the 76,000 generated trips are for business and commuting purposes. However, paragraph 5.2.13 of the April 2012 Demand and Appraisal report says one third of the HS2 trips are for business purposes. Increasing that by 25% to allow for commuting provides 41%. Here we will use 40%, which appears very high indeed compared with the 20% which applies to the nation as a whole. There are 255 effective days per year for such tips. Hence the new business plus commuter trips may number 76,000 x 255 x 0.4 = 7.75 million per year. Dividing the £15bn by that number provides £1,930 or close to £4,000 for a round trip. Nationally Travel Survey Table 0409 provides 177 commuter plus business trips per year per head per year. The GDP is about £1,500bn. Dividing that by the population, 60mn, and by the number of trips per head, the 177, provides £141, which is 13.7 times less that the £1,930.
Item (9), Capacity – the 160 average train occupancy is from the Office of the Rail Regulator’s data. It is calculated by dividing Virgin’s passenger-km by its train-km.
The rest is either well known or nearly so to those who care to look.
Paul Withrington
Network Rail is to be fined £70 million for failing performance targets on punctuality. The fine will, of course, be paid by taxpayers since Network Rail receives subsidy – fares do not even cover operating costs – bust since 1955 and before.
Furthermore Network Rail has a debt of £30 billion. That debt is notionally secured against the (imaginary) value of the Regulatory Asset Base, the RAB, on the fraudulent basis that investment in rail leads to an asset that can be traded. Instead, without Government support, the railways, if retained as railways, are worthless in the market place.
It is not Network Rail and or the banks which should be fined. Instead it is the Chief Execs, past and present, and their henchmen – all of them guilt of misleading the Government on a mammoth scale.
The claims made by those lobbying for HS2 are the top end of that; a scheme which will, if built, waste resources equivalent to the lifetime wages of 80,000 working men.
Our letter to The Times – inevitably not published ……….
The five lead letters under the heading “No HS2 please, we are British”, in The Times of March 20th were notable for the complete absence of data. So, let us be clear. The cost will be circa £80 billion including the trains and the otherwise omitted links to the stations. That is equivalent to £3,000 for every household in the land. The actuarial loss faced by those standing in the opening year of 2036 after accruing the fares out to the remote year of 2096 will be similar (Note 1).
The claim is that the proposal will generate 100,000 jobs, although many, if not most, will be relocations. If we believe the 100,000 then the cost per job will amount to £800,000. How many working lives will that vast subsidy destroy in that part of the economy which makes a profit?
The scheme is said to be “transformational”. However, it is only new or generated trips that can contribute to that. These will amount to a trivial 1.5% of existing passenger-journeys by rail and to an even more trivial 0.05% of all passenger-journeys (note 2). These percentages sabotage the notion that this thing can be transformational in any sense except perhaps that it will extract £3,000 from every household in the land, 99% of which may never use a high speed train.
The claim made in the KPMG report, that the system will generate £15billion per year in wider economic benefits, implies that the new or generated business and commuter trips will yield 14 times the benefits derived from the average for the nation as a whole, with the further implication that every existing commuter or business trip using the West Coast Main Line is yielding circa 30 times the average – an absurdity which illustrates how ludicrous the £15billion is (notes 3 and 4).
Charitably KPMG did not carry out such a reality test. Had it done so it would never have published the £15bn, or at least not with a straight face.
Is it not time for those who so shamelessly promote this thing to be prosecuted for mis-selling on a gigantic scale?
Notes and calculations:
(1) Table 15 of the October 2013 economic analysis provides a net loss to the Government of £31.5bn at the 2011 price and discount base. Rolling that up at the Treasury Discount rate of 3.5% to the opening year of 2036 yields £74bn representing the actuarial loss at 2011 prices faced by those standing in that year, assuming the forecast fares out to the remote year of 2096 actually arise.
(2) HS2 Ltd also says that the project will generate 76,000 new passengers-journeys per day, (FoI request 13-873). The 76,000 corresponds to roughly 22.8 million per year. It is only those new trips which can be “transformational” since all the rest (obviously) pre-exist. There are currently 1.5 billion passenger-journeys per year by surface rail, and 43.5 billion passenger-journeys by all modes (walk and cycle excluded). Hence generated, or new, passenger-journeys may account for a trivial 1.5% of all surface-rail journeys and for an even more trivial 0.05%, or one in 2,000, of all passenger-journeys. Clearly that cannot be transformational
(3) As above, generated, or new, trips total 76,000 per day. If 40% are for business or commuting (Para 5.2.13 of the Ariil 2012 Demand and Appraisal report provides 33% for business. NTS data suggest adding 25% for commuting for longer distance trips) they will number 30,400 per day. For such trips there are an effective 255 days per year. Hence the annual new business plus commuter trips will be circa 7.75 million. Dividing KPMG’s £15bn by the 7.75 million provides an average value for these new business or commuter trips of circa £1,930, or circa £4,000 per round trip. The National Travel Survey provides 177 such trips per head per year or £10.6 billion for the nation as a whole. The GDP is circa £1.5bn. Hence the value per trip is £141, 14 times less than the £2,600 for these marginally generated HS2 trips, illustrating how unbelievable the £15bn is. After all:
Charitably KPMG did not carry out such a reality test. Had it done so it would never published the £15bn, or at least not with a straight face.
(4) These new trips arise only because journey times will have been reduced somewhat. Pre-existing trips did not need such an encouragement. Hence they will have higher WEBs than the generated trips. In standard economic analyses values associated with generated trips are half those attributed for those which already exists. The implication is that the value per trip attributable to a pre-existing business or commuter trips on the West Coast Main Line is double that for the generated ones, yielding a 30 times as much as those for the nation as a whole.
(5) In October 2013 we asked HS2 Ltd, under freedom of information legislation, to provide the proportions of trips which were for business, commuting and leisure. That data must be available since, without it, the economic analysis could not be carried out. HS2 Ltd claimed it does not hold the information. We have continued to press for the data but without success. The date is now 28th March 2014. We regard this failure on behalf of HS2 Ltd as symptomatic of an organisation which will do all it can to prevent key data from reaching the public.
The 30% we have used is consistent with old reports.
